Key takeaways
You don’t need to be a design dynamo to create a good infographic. All you need are the right ingredients: good data, a basic design tool, and an understanding of core design principles.
That last ingredient may seem daunting if you’ve never created an infographic before. But fear not! The rest of this blog post covers the essential elements of a good infographic and highlights the qualities that lead to the worst infographics. You’ll also see examples of infographics.
Creating your next (or first) infographic will be easy as pie if you keep this recipe in mind.
In this guide:
- What is an Infographic?
- Why Use Infographics?
- 4 Elements of Good Infographics (and Examples of Good vs. Bad Infographics)
First, what is an infographic?
An infographic is a long-form design that tells a story by presenting data and other complex information in an easy-to-understand, visually-appealing way.
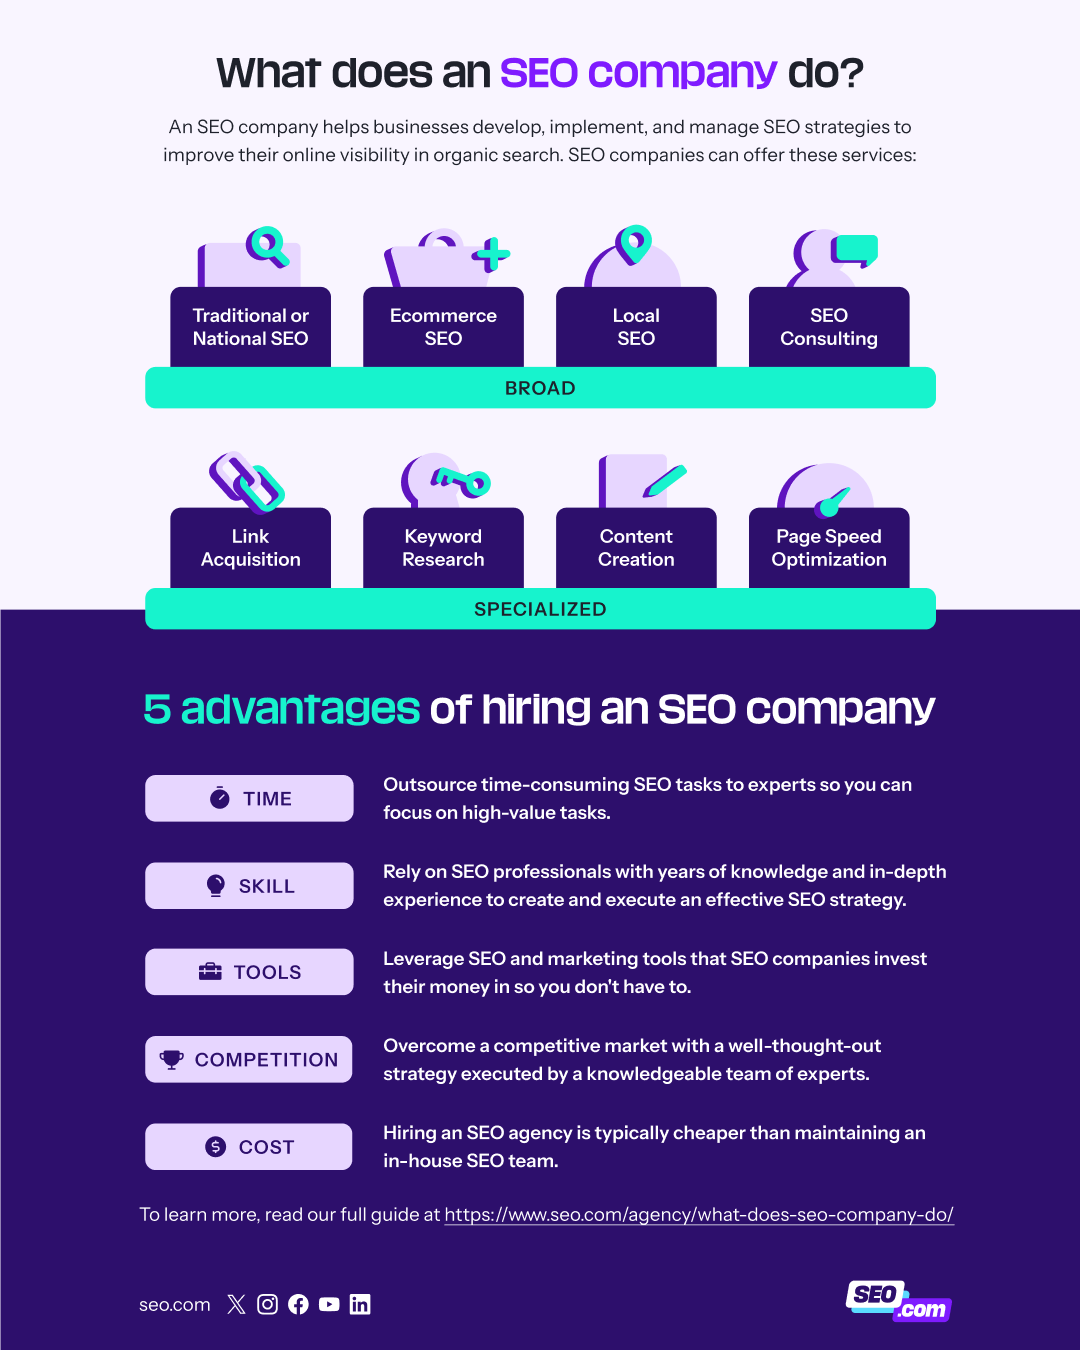
Infographic by SEO.com on What Does an SEO Company Do?
You can think of an infographic as a visual essay. You start with a thesis — which is the main point you want to make — and then use a variety of data visualizations and any other relevant imagery and text to support that thesis.
The infographic below follows the visual essay format.
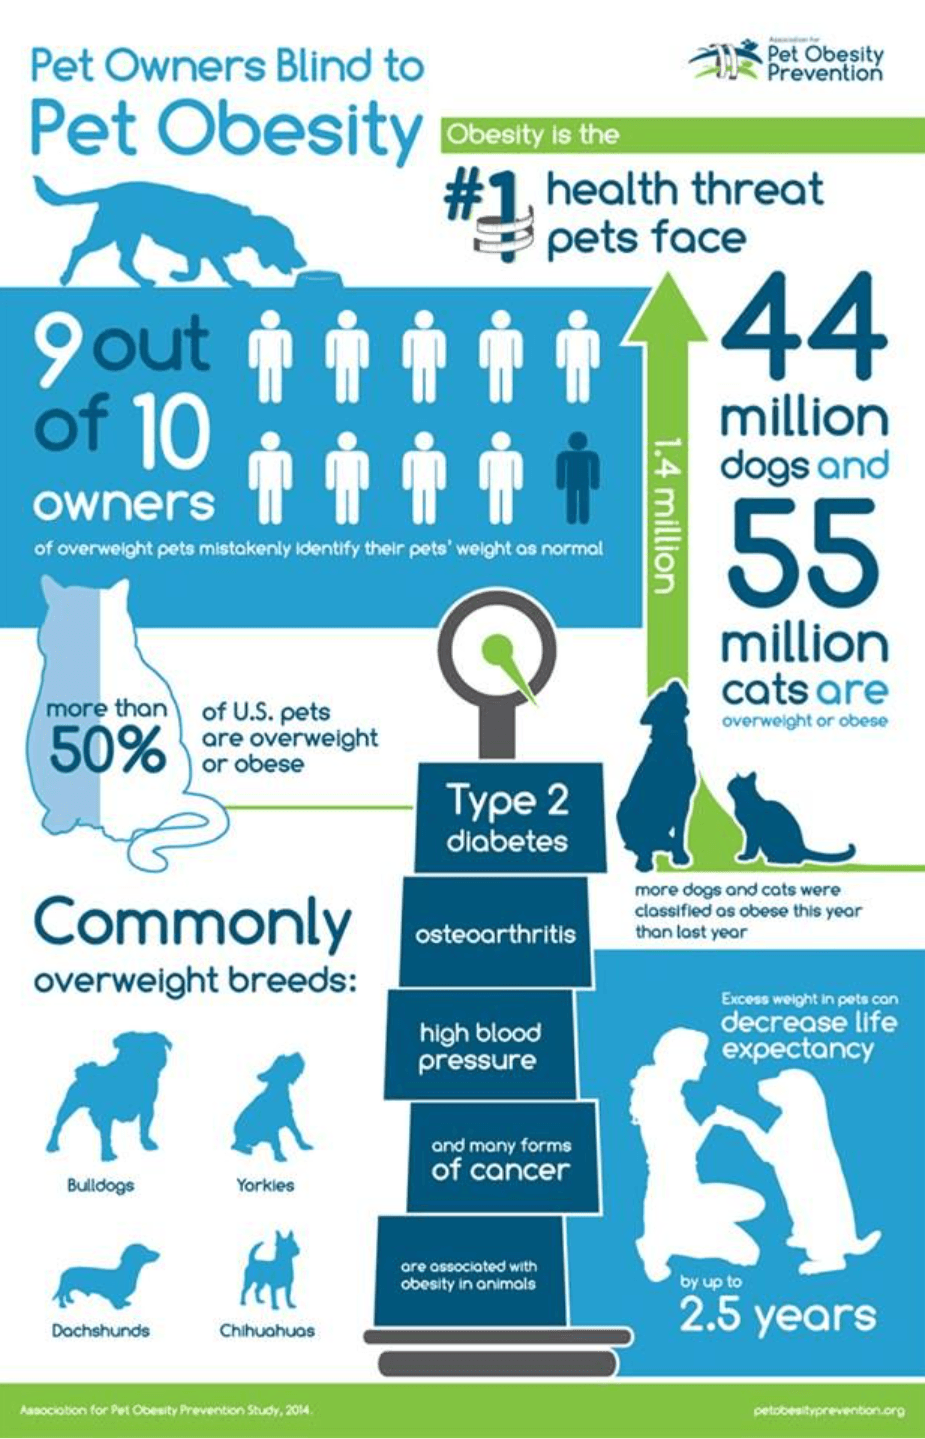
Source: Holiday House Pet Resort & Training Center
With just a quick skim, you can infer the thesis of the design: obesity in pets is a dangerous, widespread problem that owners do not take seriously enough. All of the data included in the infographic supports this claim, including statistics about pet obesity and the list of health problems related to obesity.
Data visualization is exactly what it sounds like. You take complex data and pull it into a format that’s easy to understand — and you don’t need to be in a data-focused field like healthcare. You’re not focused on proving a point with basic data visualization. Leave that job to a full-fledged infographic.
Data visualization focuses on presenting data so that the viewer understands it, as in the example below.
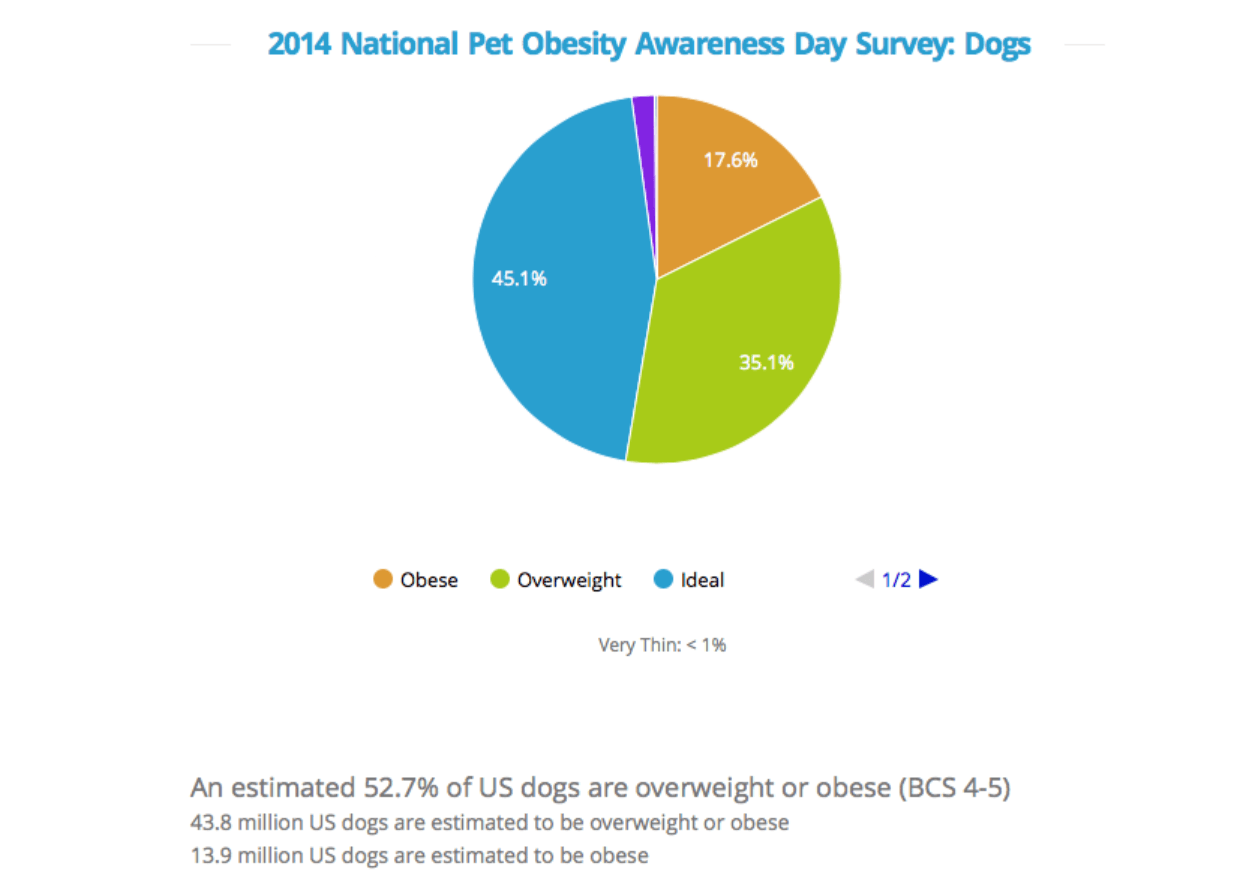
Source: American Kennel Club
So, while an infographic includes an element of visualization, the two terms are not the same.
Now that you understand the basics, let’s move on to the elements of a good infographic.
Why Use Infographics?
In today’s fast-paced digital world, capturing and retaining audience attention is more challenging than ever. This is where infographics shine. Infographics are powerful tools for communicating complex information quickly and effectively, offering a multitude of benefits for businesses and individuals alike. Infographics are a great way to:
- Simplify Data: A primary reason to use infographics is their ability to simplify complex data. By transforming complex data into visually appealing charts, graphs, and illustrations, infographics make it easier for audiences to understand and remember key takeaways. This is particularly valuable when working with technical or data-heavy topics.
- Create Highly Shareable Content: Infographics are also highly shareable. Their visually engaging nature makes them ideal for social media, where they can attract attention and generate buzz around your brand or message. A well-designed infographic can go viral, significantly expanding your reach and influence.
- Elevate SEO: From an SEO perspective, infographics can also boost your website’s visibility. By embedding infographics on your site and encouraging others to share them, you can earn valuable backlinks, a crucial ranking factor for search engines. Also, the text content in and around your infographic provides opportunities to target relevant keywords, further improving your search engine rankings.
- E-E-A-T: Infographics can enhance your E-E-A-T (Experience, Expertise, Authoritativeness, and Trustworthiness), a key factor in Google’s ranking algorithm. By presenting well-researched data and insights in a visually compelling format, you can effectively demonstrate your expertise and build trust with your audience.

4 elements of good infographics (and examples of good vs. bad infographics)
1. A good infographic is easy to understand
A good infographic can make the most complex data easy to grasp. Be sure to use the right type of data visualization, then thoughtfully combine a clean layout, clear hierarchy, and visual cues to guide your audience through the content. Every visual cue, such as colors, lines, and icons, should have a purpose in crafting your visual story.
Jesslyn Faustina
Lead Web & Product Designer
WebFX
The worst infographics present information in a confusing way. Just look at these maps comparing iOS and Android users in the U.S.

Source: PC Mag
The example above makes comparing the saturation of each operating system easy. The designer rolled all of the information into one map and used recognizable colors and symbols to represent the data.
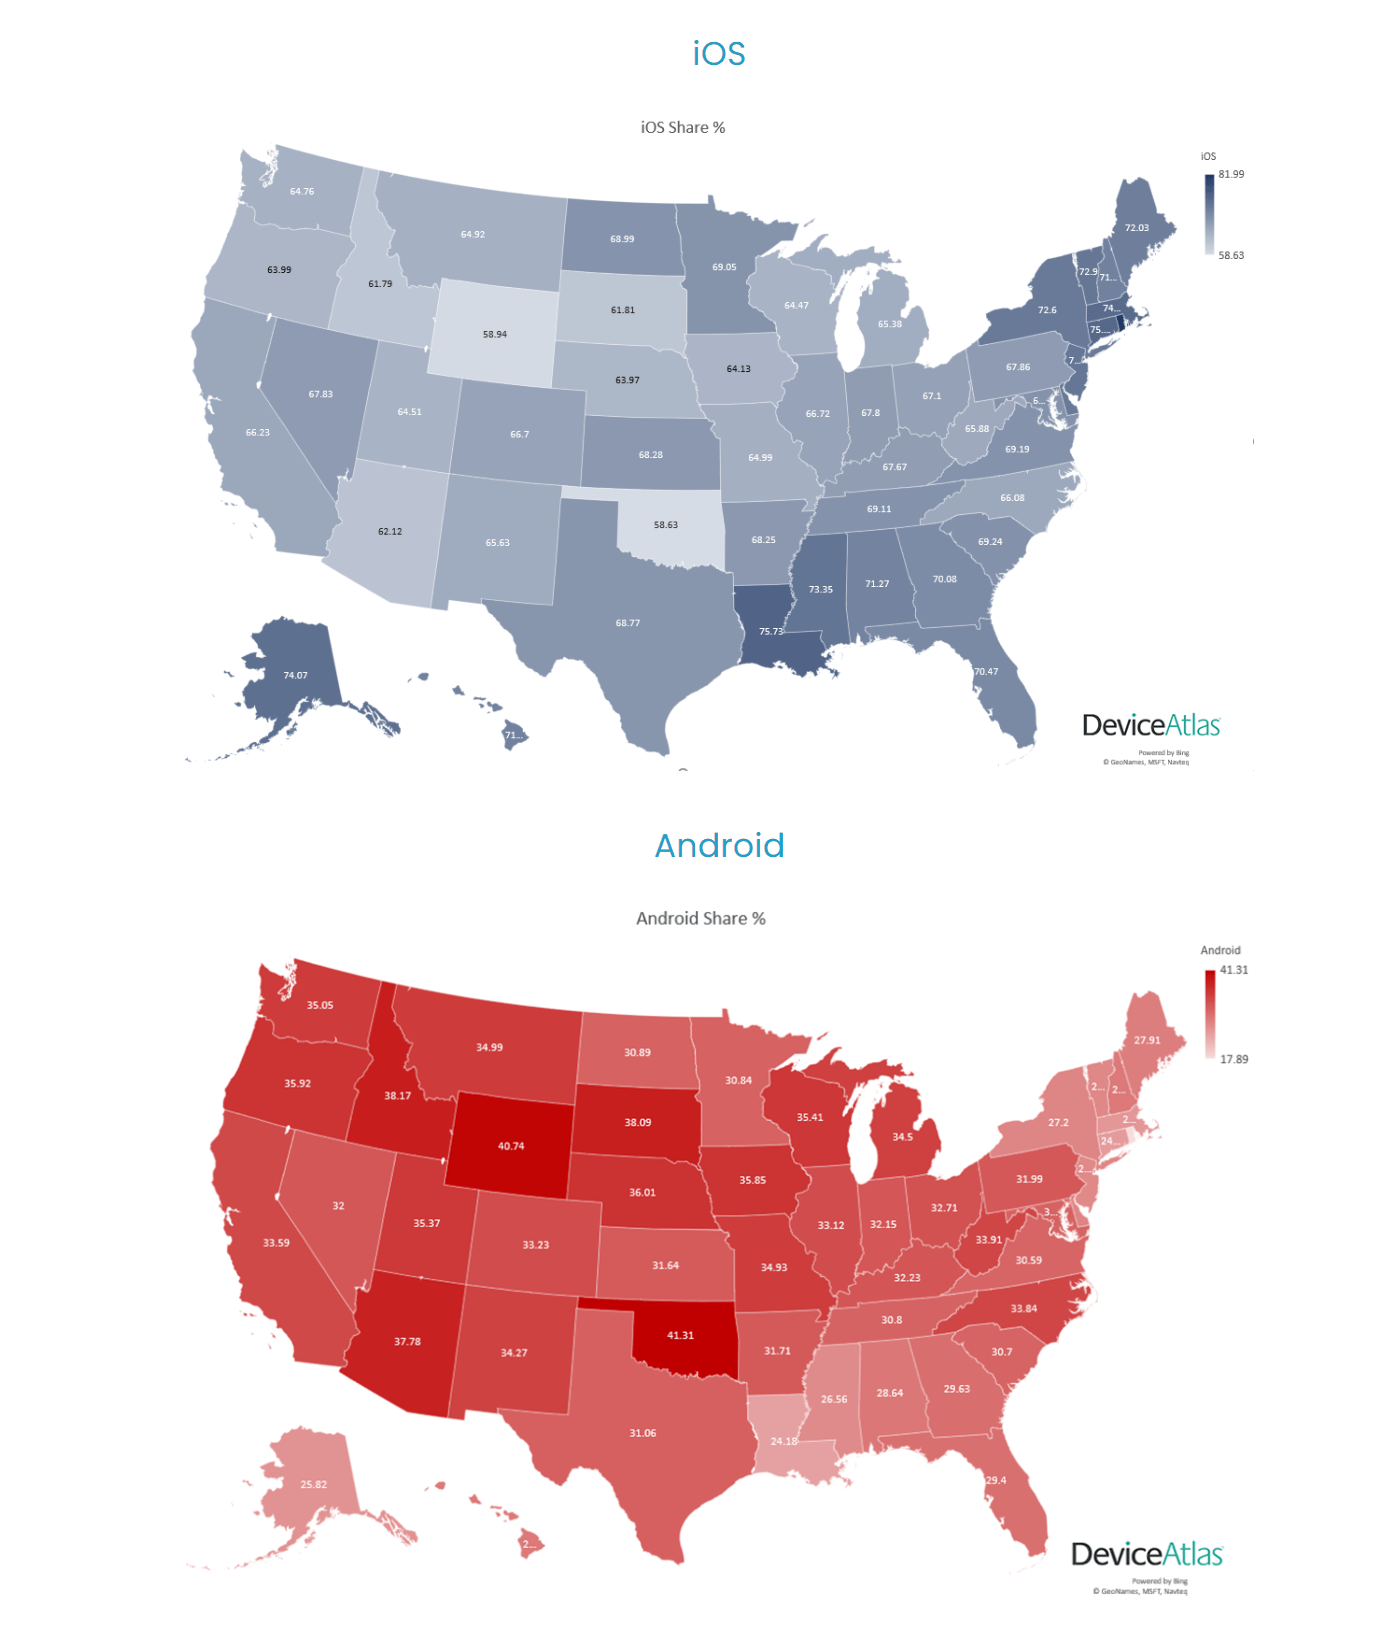
Source: DeviceAtlas
While the two-map design above includes more detailed information, the fact that the data is split into separate designs makes the comparison less impactful and harder to follow.
If your infographic doesn’t present your topic in an easy-to-understand format, you risk losing valuable members of your audience and missing out on the chance to represent yourself as a thought leader.
2. A good infographic uses the right type of data visualization
You wouldn’t use salt when a recipe calls for sugar, so why would you use a line graph when a pie chart would communicate your point more effectively?
You don’t just need good data to avoid making bad infographics. What makes a good infographic is the ability to visualize the data well, too.
Just take a look at these graphs that highlight pet ownership statistics.
In the first example, you see what looks like a singular bar chart that highlights the percentage of people who own pets in each generation. Yes, the chart technically makes sense and the math works, but the presentation makes the data harder to understand.

Source: Spots
When the data is one piece of a whole, rather than a standalone statistic, it’s often best to illustrate the point with a finite shape.
That’s what the next design uses. A circle is not open-ended, and each piece of data clearly represents a piece of the pie.
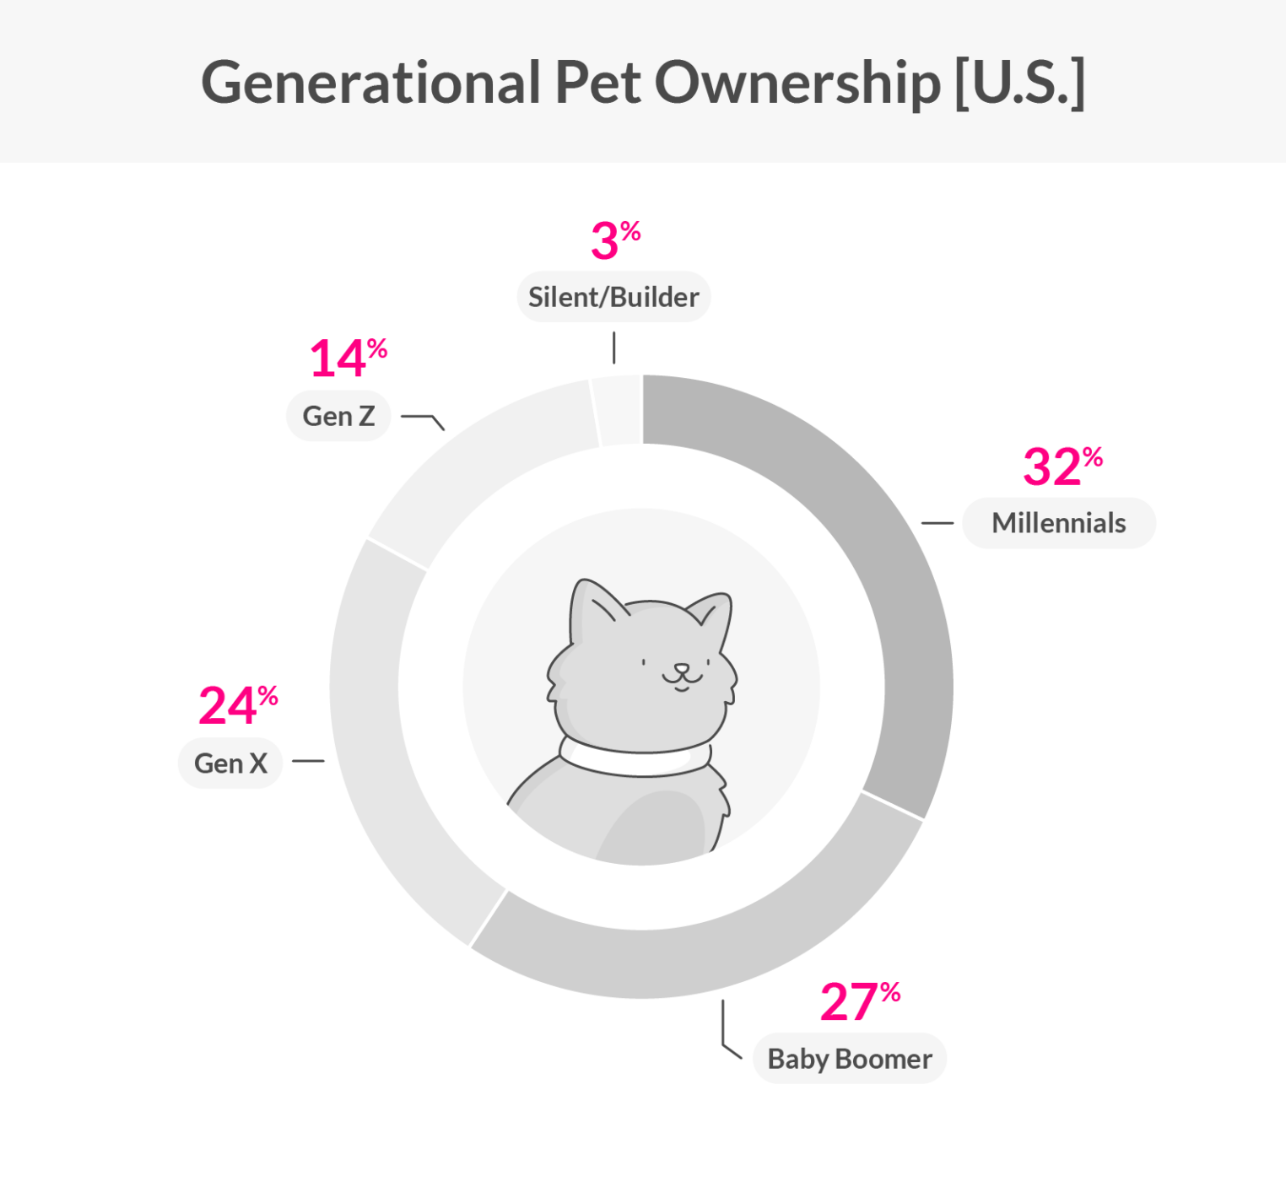
Source: Lemonade
The lesson here? Match the format of your data visualization to the data itself.
3. A good infographic has some form of organization
If you’ve ever been to (or Googled) Times Square in New York City, you know that there’s a lot to look at. Glowing billboards flash all around, costumed mascots vie for your attention, and busy travelers push their way through the crowd. It’s a lot to take in, especially if it’s your first time in the city.
You don’t want to emulate Times Square in your designs. You need some form of organization or hierarchy that tells the viewer where they should look first, and how they should continue down the page.
Don’t worry — you don’t need a large flashing arrow to get someone’s attention. Using bold colors, large text, or even directional lines can help draw the eye in the proper direction.
In the first example below, you see that a lot is happening. There are several different colors, a variety of fonts, many lines, and one too many icons.
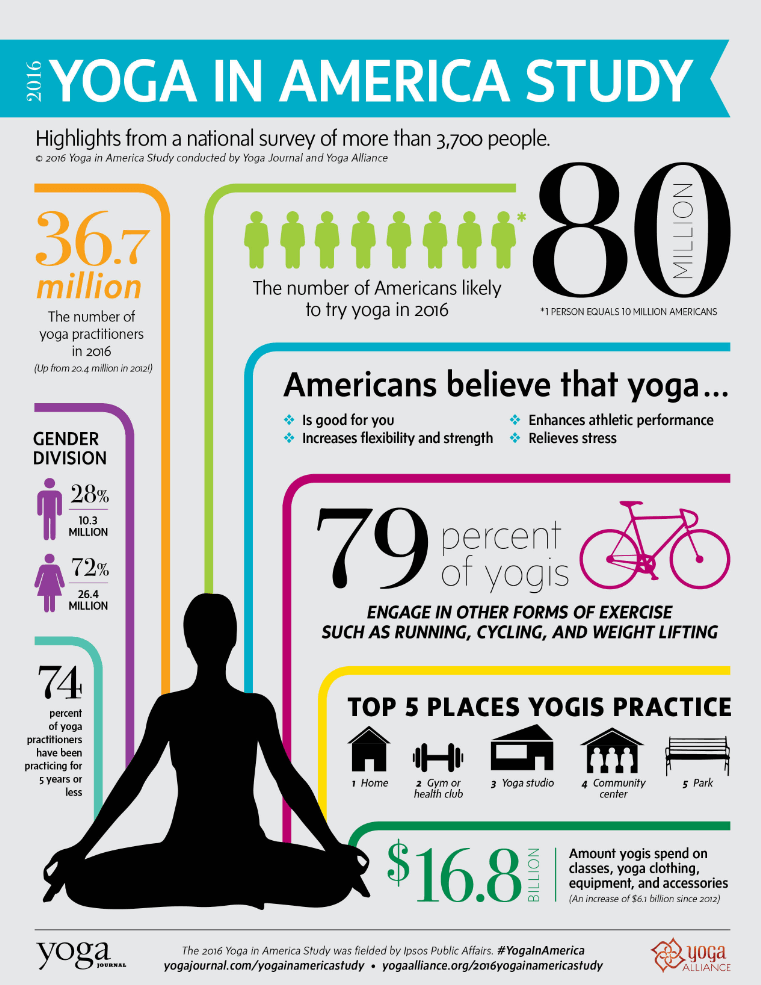
Source: Yoga Alliance
Moving on from bad infographic examples, the design below makes it easy for the reader to follow along. You don’t need to wade through an abundance of text and icons, the design has a clear hierarchy, and the important numbers stand out.

Source: The Good Body
With less clutter and more structure, your audience will have an easier time following and comprehending your messages.
After all, an infographic tells a story. You wouldn’t want someone to read your story out of order.
4. Good infographics use visuals that add to the story
The megalith that is the “Barbie” movie has sparked much discussion about viral marketing trends. So much so that a wealth of infographics have made their rounds online.
The Semrush team created an infographic that highlighted the international phenomenon and its creative marketing tactics.
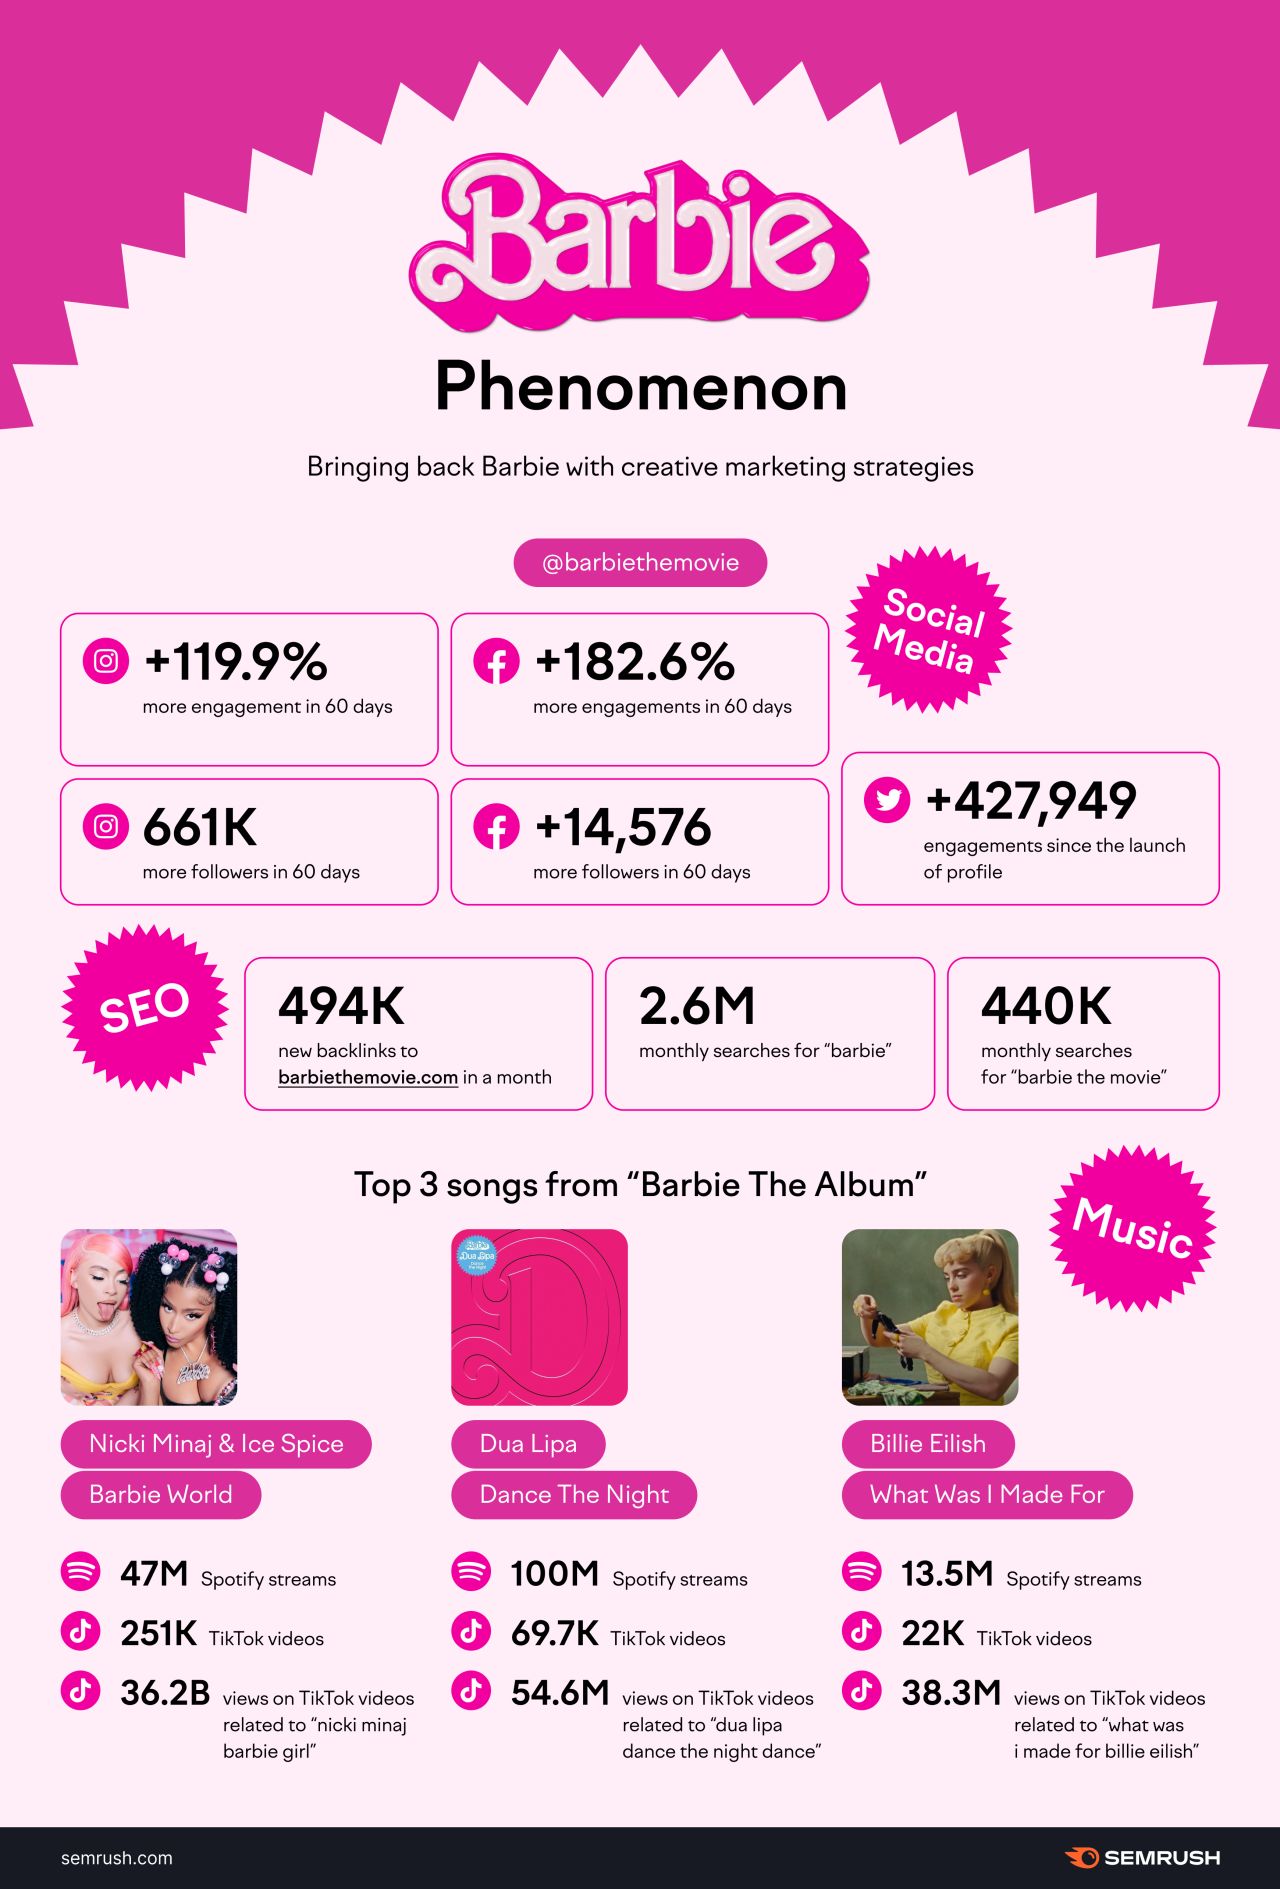
Source: LinkedIn
Identifiable logo aside, everything from the color of the infographic to the shapes used throughout emphasizes the point that the movie’s marketing was key to its success.
You should do the same to avoid making bad infographics. The colors, the shapes, the photos, the icons, and every other visual element should have some impact on the story. Make no unintentional choices.
Words and numbers aren’t the only things that can tell a story.
Ready to knock everyone’s socks off with infographics?
Now that you’ve made it through this blog post, you’ll be able to identify the elements of good vs. bad infographics.
Just remember that mastering your design skills takes time, and even the most experienced designers wonder if their creations will be labeled “worst infographics of all time”.
With practice and revisions, you’re sure to design infographics that enthrall your audience.
Stop Writing Blog Posts that Don’t Drive Results
Let our professional copywriters help create valuable, strategic content that drives qualified traffic to your website!


Stop Writing Blog Posts that Don’t Drive Results
Let our professional copywriters help create valuable, strategic content that drives qualified traffic to your website!
Writers